What is Response Time Monitoring?
TL;DR
Response time monitoring tracks how fast your server responds to each request - not just whether it’s available. A site can be technically “up” and still lose users to slow load times. Under 200ms feels instant; over 3 seconds causes 50%+ abandonment on mobile. Because response times degrade before servers fail outright, this data also serves as an early warning signal for approaching outages.
Response time monitoring is the practice of measuring how long your website or server takes to respond to incoming requests. It tracks the full round trip, from the moment a visitor’s browser sends a request to the moment it receives a complete response, and alerts you when that time crosses a threshold you’ve set.
If your site takes 200ms to respond right now, response time monitoring tells you when that number creeps to 500ms, then 1,200ms, then timeout. It’s the difference between catching a slow leak and waking up to a flood.
At PingPing, we measure response time on every single uptime check (every 30 seconds), so you’re working with 2,880 data points per day instead of the 288 you’d get from a tool that checks every 5 minutes.
Why Response Time Matters More Than Uptime Alone
Your site can be technically “up” and still be failing your users.
Picture this: a customer clicks your pricing page. The server responds, but it takes 4.7 seconds. They don’t see an error page. They don’t get a timeout. They just leave. Your uptime dashboard says 100%. Your revenue says otherwise.
Research by Jakob Nielsen established 100ms as the threshold for what feels “instant” to a user, and Google’s RAIL model uses the same number. Once you cross one second, people start noticing. Past three seconds, more than half of mobile visitors will abandon the page entirely, according to a 2017 Google study that measured page load times across 11 million mobile ad landing pages.

Response time also feeds directly into search rankings. Google confirmed that page speed is a ranking factor for both desktop and mobile results. A site that loads in 800ms will, all else being equal, outrank one that loads in 3 seconds.
For solo founders running a revenue-critical SaaS, the math is simple: Amazon famously found that every 100ms of additional latency cost roughly 1% in sales. On a SaaS checkout page processing $10,000/month, 500ms of extra delay could mean $500/month in lost revenue, silently, without any alert firing.
What Makes Up Response Time
Response time isn’t one number. It’s a chain, and the slowest link sets the pace.
DNS lookup happens first. Your visitor’s browser asks “where does this domain live?” A well-configured DNS resolves in 10-20ms. A misconfigured one can take 200ms+ before the connection even starts.
TCP connection comes next. This is the handshake that establishes the communication channel between browser and server. On a good connection, 20-50ms. Add distance or congestion, and this balloons.
TLS negotiation adds another round trip for HTTPS sites (all sites at this point). If your SSL certificate has issues (expired, misconfigured, using outdated protocols), this step either slows down or fails entirely.
Time to First Byte (TTFB) is the big one. It measures how long your server takes to process the request and start sending data back. This is where application code, database queries, and server resources come into play. Google’s web.dev documentation considers a TTFB under 800ms acceptable, though under 200ms is ideal.
Content download is the final stretch: transferring the full response payload. A 50KB HTML page downloads fast. A 2MB unoptimized image does not.
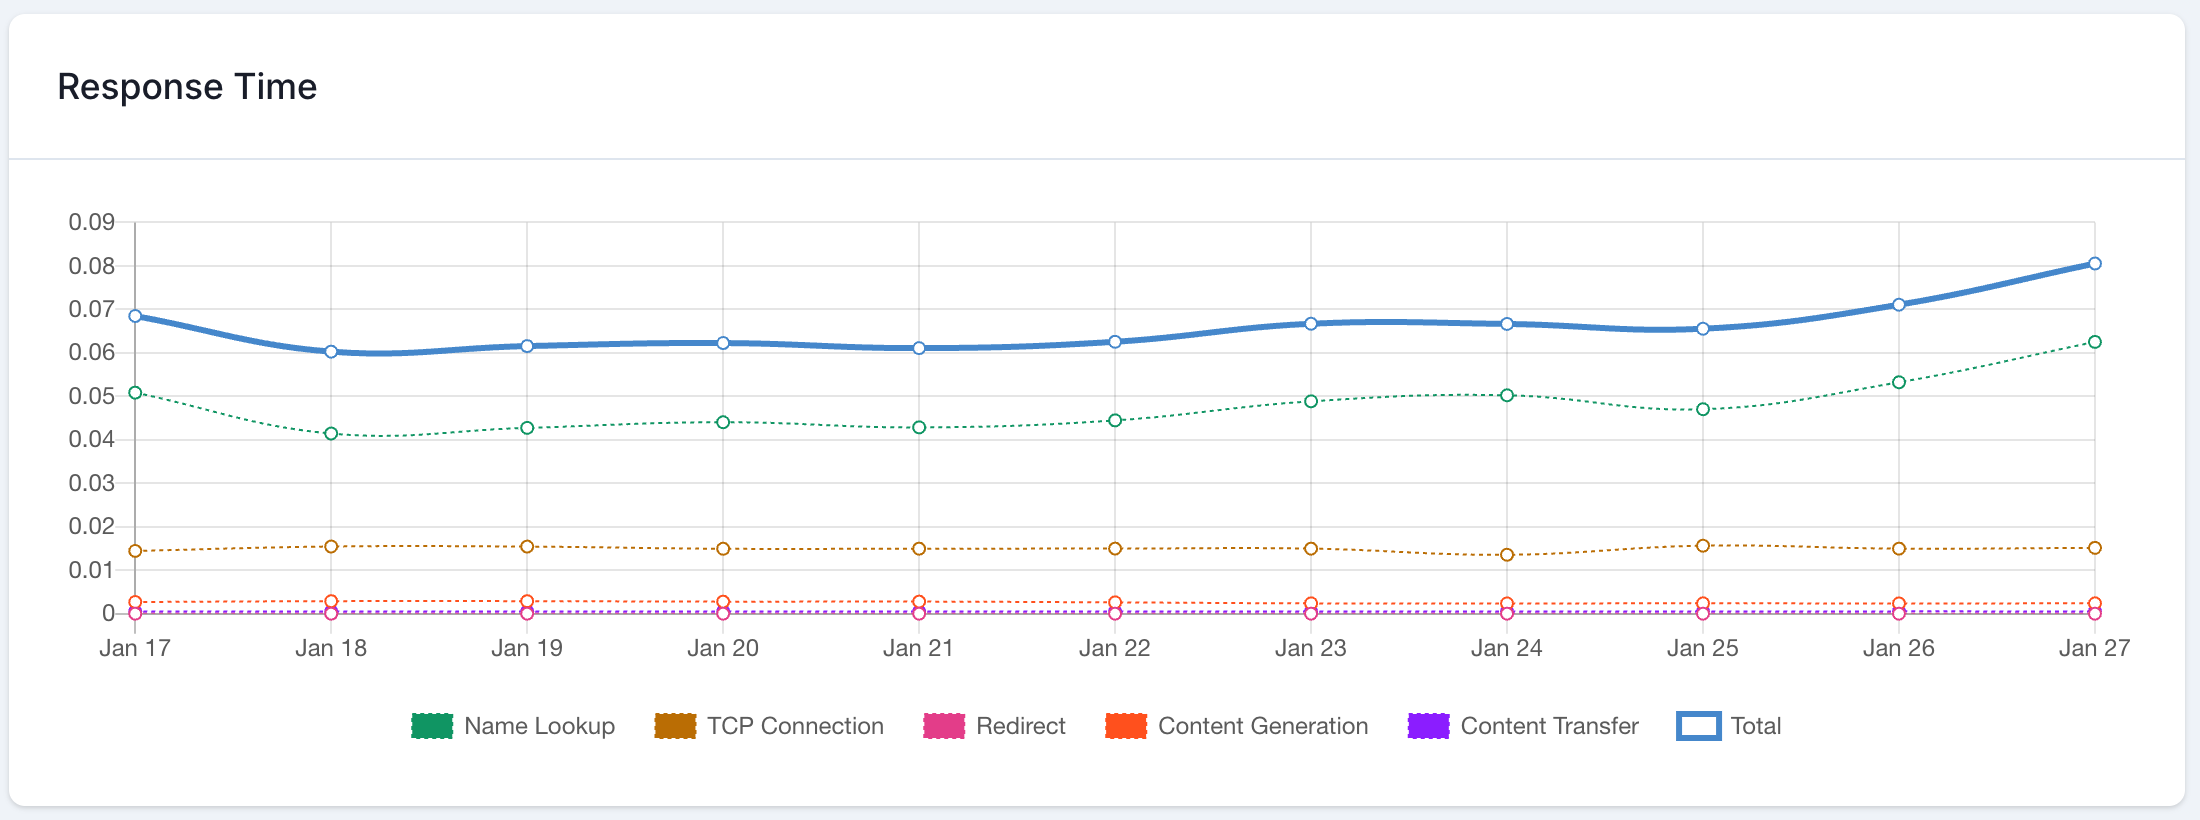
PingPing breaks down each of these components on every check, so when response time spikes, you can see exactly where the bottleneck is (DNS, server processing, or data transfer) without needing to guess.

Response Time Benchmarks by Industry
Not every site needs to hit the same numbers. A financial trading platform and a personal blog have different performance requirements. Here’s what users in each sector typically expect:
| Industry | Target Response Time | Why |
|---|---|---|
| E-commerce | Under 2 seconds | Each 100ms delay costs ~1% in sales |
| SaaS / Web Apps | Under 1 second (pages), under 300ms (API calls) | Users interact frequently; cumulative delay kills productivity |
| Financial Services | Under 200ms | Transaction speed affects real money |
| Media & Content | Under 2.5 seconds | Users bounce fast when content loads slowly |
| Healthcare | Under 3 seconds | Regulatory and accessibility considerations |
These aren’t aspirational numbers. They’re the thresholds where measurable user drop-off begins. Your own baseline might be different - and that’s fine. The point is to know your baseline and catch deviations early.

How PingPing Tracks Response Time (and How That Compares)
Most monitoring tools measure response time. The differences are in frequency, granularity, and what they do with the data.
Check frequency matters more than you’d think. If your tool checks every 5 minutes, a 3-minute outage might slip through entirely. A slow degradation that builds over 2 minutes won’t even register as a blip. PingPing checks every 30 seconds on all plans, giving you 2,880 measurements per day.
Component-level breakdown is where PingPing goes further than a simple “your response time was X ms.” Each check breaks the response into DNS, connection, TLS, TTFB, and transfer time. When your response time jumps from 300ms to 1,200ms, you can immediately see whether it’s a DNS issue (probably your registrar), a TTFB spike (probably your server or database), or a transfer problem (probably your page size).
Alerting philosophy differs too. Some tools alert on every spike. A single slow response can be a network hiccup, a cold cache, or a CDN routing glitch. PingPing’s approach is to give you the data to set meaningful thresholds - alert when response time exceeds 2x your normal average, and watch trends over days, not minutes.
Here’s a practical comparison:
| Feature | PingPing | Typical Enterprise Tool | Free-Tier Tool |
|---|---|---|---|
| Check interval | 30 seconds (all plans) | 30-60 sec (premium tiers) | 5 minutes |
| Data points/day | 2,880 | 1,440-2,880 | 288 |
| Component breakdown | DNS, TCP, TLS, TTFB, Transfer | Varies | Usually just total time |
| Historical data | Full history with trend view | Retention limits vary | Often 30-90 days |
| Setup time | Under 2 minutes | 30-60 minutes | 5-10 minutes |
See detailed comparisons with UptimeRobot, Pingdom, and other monitoring tools.
Reading Response Time Data Without Overreacting
Collecting response time data is straightforward. Interpreting it correctly is where most people go wrong.
Averages lie. If your average response time is 400ms, that sounds fine. But if 95% of requests complete in 200ms and 5% take 4,000ms, you have a serious problem that the average masks. Always look at p95 and p99 percentiles - they show what your slowest users actually experience.

Single spikes don’t matter. A 3-second response once per hour is noise. A pattern of 3-second responses every day at 2 PM is a signal - probably a cron job, a backup process, or a traffic pattern you haven’t accounted for.
Trends beat snapshots. A gradual climb from 200ms to 800ms over two weeks is a warning sign that something is degrading - growing database tables, memory leaks, increasing payload sizes. By the time it hits 2,000ms, your users have already noticed. PingPing’s historical trend view makes these slow drifts visible.
Correlate with uptime data. Increasing response times often predict outages. A server under growing load responds slower before it stops responding entirely. If you’re watching response time alongside uptime monitoring, you catch problems in the degradation phase rather than the outage phase. Learn more about how fast you should know your site is down.
How to Improve Slow Response Times
When your monitoring tells you something is slow, here’s where to look, roughly in order of impact:
Check your server. CPU, memory, disk I/O. If your server is maxed out, no amount of code optimization will help. This is especially true on shared hosting, where a noisy neighbor can tank your performance without any change on your end.
Optimize your database. Slow queries are the most common cause of high TTFB. One missing index on a table that grew from 10,000 to 1,000,000 rows can turn a 5ms query into a 5-second query. Add query monitoring to your stack if you don’t have it already.
Use a CDN. A Content Delivery Network caches your static assets on servers physically close to your users. Someone in Tokyo shouldn’t have to wait for a round trip to your server in Amsterdam for a CSS file. Cloudflare, Bunny CDN, and Fastly all handle this well.
Enable compression and caching. Gzip or Brotli compression reduces transfer sizes by 60-80%. Browser caching prevents repeat visitors from re-downloading assets they already have. Both are server configuration changes, not code changes.
Reduce payload size. Audit your HTML, CSS, and JavaScript. Minify everything. Lazy-load images below the fold. Remove unused libraries.
Response Time as an Early Warning System
Response time spikes are often the first sign of an approaching outage. A server under increasing load doesn’t suddenly fail. It slows down first. The database starts queuing requests. Memory pressure builds. Connections start backing up. And all of that shows up as climbing response times minutes before the server actually stops responding.

This is why response time monitoring and uptime monitoring work best together. Uptime tells you “it’s broken.” Response time tells you “it’s about to break.”
Every minute of degraded performance costs money, not just outages. Understanding the cost of website downtime puts those creeping response times in perspective.
Never miss an expiry
PingPing’s 30-second monitoring checks give you enough data density to spot degradation trends before a slowdown becomes a full outage.
Related guides
What is uptime monitoring?
How uptime monitoring works and why check frequency determines what you catch.
What is 30-second monitoring?
Why checking every 30 seconds rather than every 5 minutes changes what problems you can detect.
The cost of website downtime
How to calculate what slow performance and outages actually cost your business.
FAQ
What is a good response time for a website?
Under 200ms feels instant to users. Under 1 second is acceptable for most websites. Anything over 3 seconds causes significant user drop-off, especially on mobile. Your specific target depends on your industry and what your users are trying to do.
How often should you monitor response time?
The more frequently you check, the more quickly you catch problems. A 5-minute check interval can miss brief outages entirely. PingPing checks every 30 seconds on all plans, which gives you enough granularity to catch issues that shorter intervals would miss entirely.
What causes sudden response time spikes?
Common culprits include traffic surges, database query slowdowns, server resource exhaustion, DNS issues, CDN misconfigurations, and third-party service delays. PingPing’s component breakdown helps you narrow down which part of the request chain is causing the spike.
Is response time the same as page load time?
No. Response time measures how long the server takes to respond to a request. Page load time includes everything after that - parsing HTML, loading CSS and JavaScript, rendering images, running scripts. Response time is one component of page load time, but it’s the component your server controls.